Early access
See which patch of the cap looks stressed before the walk-over starts.
Landfill Cover Monitor reads vegetation stress across your capped cell each quarter from multispectral drone imagery and gives your inspector a list of places to walk. It is an early-access pilot, and the method is still being proven on real sites.
- Resolution finer than 10 cm
- Cadence Quarterly
- Platform Drone or crewed aircraft
- Spectral Multispectral
- Thermal No
- 1 Access road and the inspector's sight line
- 2 Stress patch behind the crown
- 3 Soil and grass over the geomembrane and waste
How the cap gets checked now
On a closed landfill the cover is the whole defence, and checking it is a walk. The inspector goes over the cap on the schedule in the post-closure plan with a checklist and a camera. Settlement, ponding, erosion rills, bare ground, exposed liner, anything that looks like a seep. What turns up goes into the inspection report with GPS points and photos, and into the file the regulator can ask for.
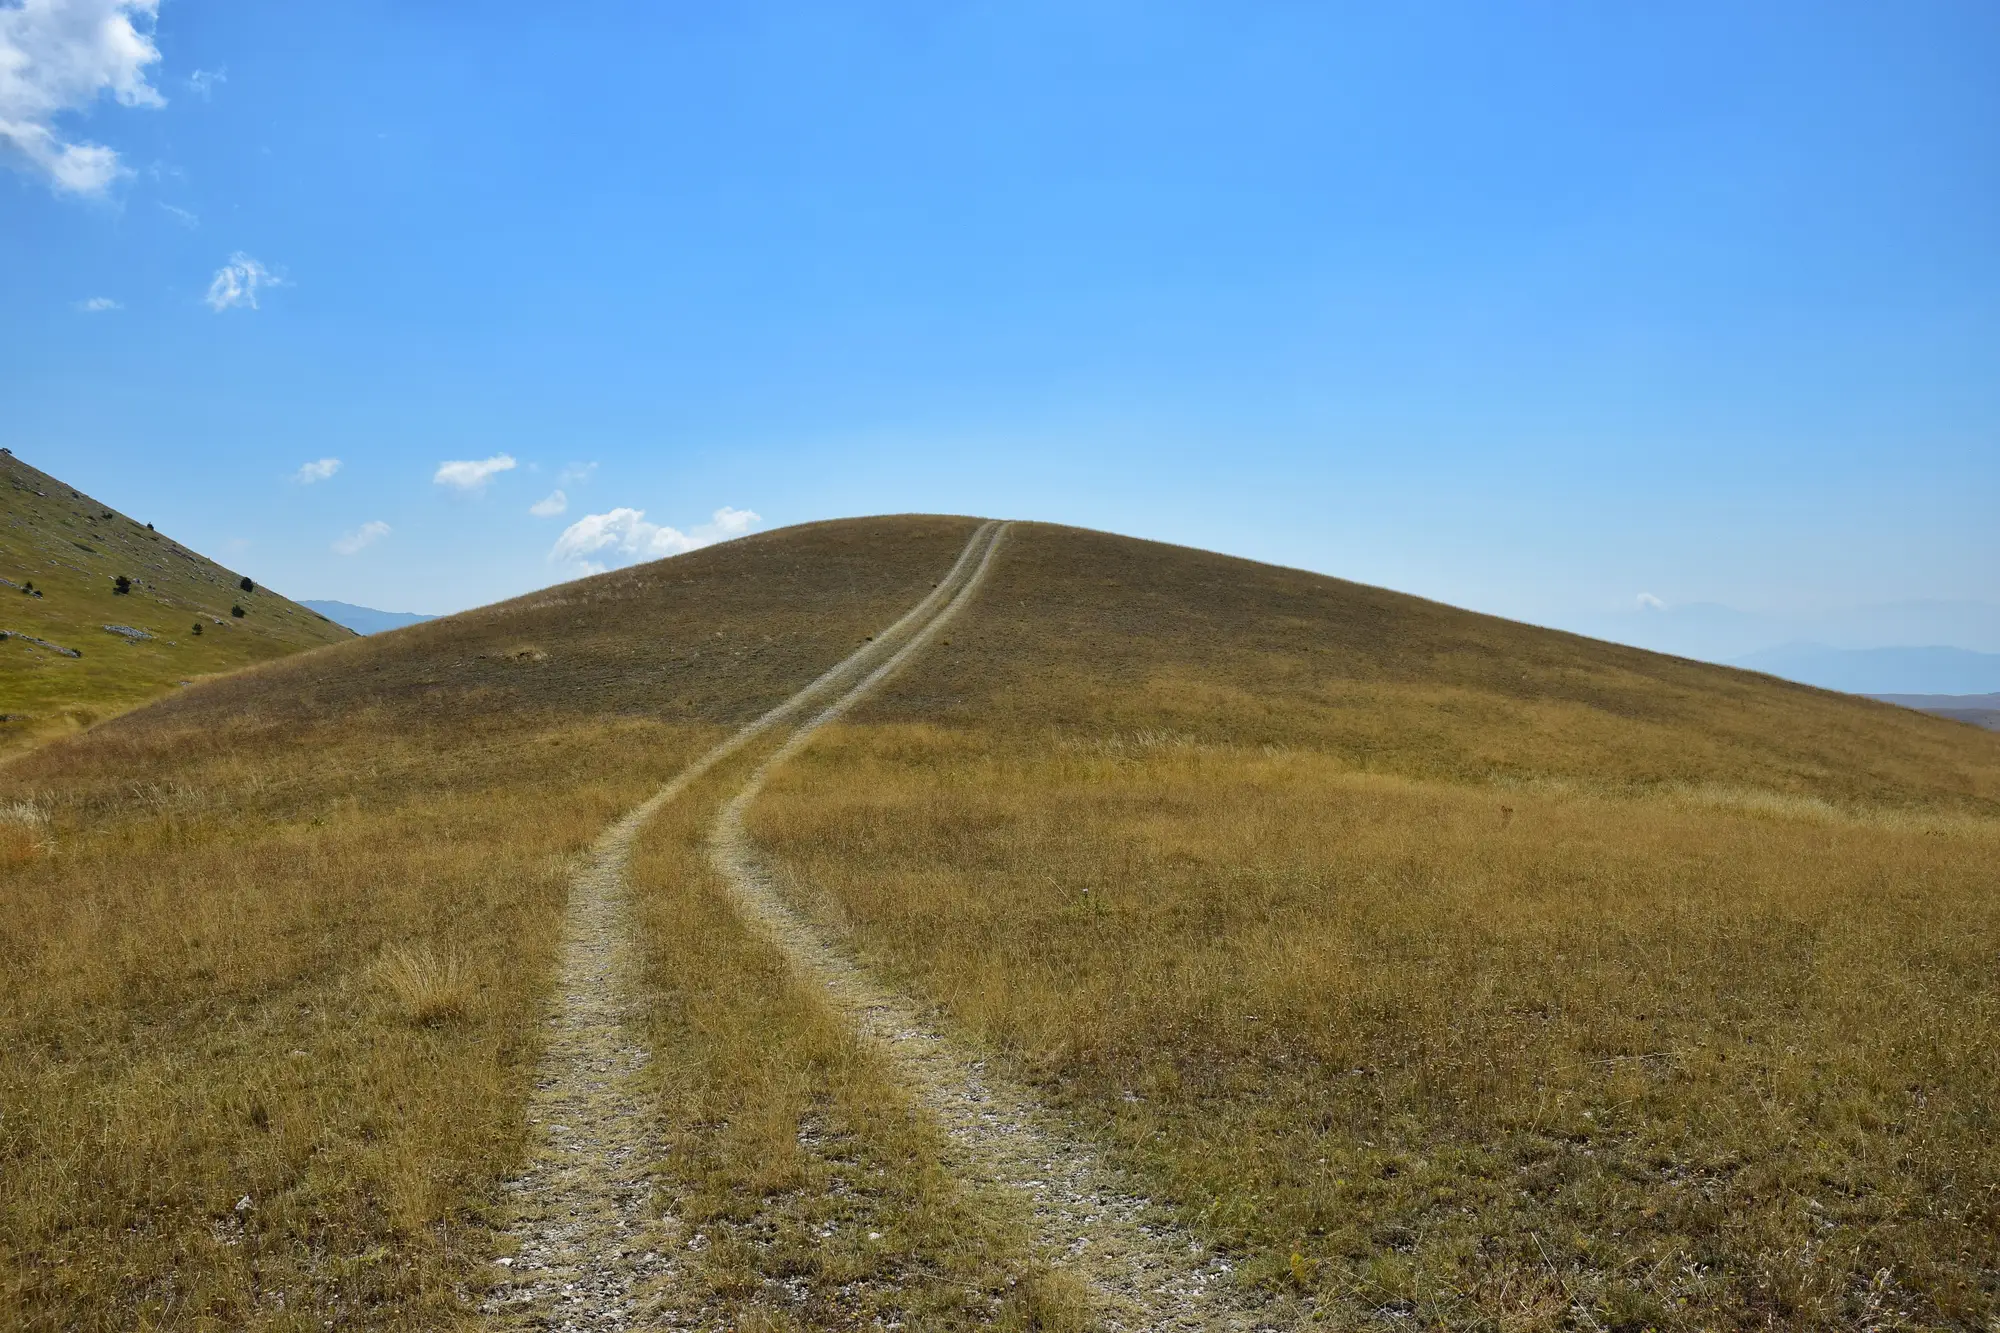
It breaks down on scale and on sight lines. A large cell is a lot of ground on foot, and a closed site runs on thin staff. From the access road the grass looks about the same all summer. A dead patch beside the road gets noticed. One behind the crown of the cap can sit there for a season. And after a dry stretch half the cap looks rough, so the inspector can't tell drought from a problem under the soil without digging or probing.
A quarterly multispectral pass shows where the vegetation is doing worse than the ground around it. Your inspector still does the walking, but starts with the zones that stand out instead of the whole cell.
What comes back each quarter
One delivery per quarterly flight. On a pilot, that covers the capped cell or cells you choose.
Stress-flag map
GeoPackage or PDF mapVegetation-stress zones laid over your capped cell, so you can see where the cap's plants are doing worse than their surroundings. Opens in ArcGIS or QGIS, and the PDF is for the report binder.
Change note
Short PDFWhat shifted against the prior quarter's flags: zones that appeared, zones that cleared and zones that held. From the second quarter on.
Flagged-zone coordinates
CSVA list of stress patches with coordinates, ready to load on a phone or tablet for a targeted walk-over, in place of a full pass over the cell.
How it works
Draw the cell
Send the boundary of the capped cell, as a shapefile or a closure-plan drawing. Tell us about any areas that are mowed, planted or disturbed on a schedule.
Fly the quarter
A multispectral drone flight, or a crewed aircraft where the cell is too big for a drone, over the whole cell once a quarter.
Score and compare
Vegetation indices are computed across the cell and compared with the same cell's earlier quarters. Zones that sit apart from their surroundings get flagged.
Walk the flags
You get the map, the change note and the coordinate list. Your inspector goes to the flagged zones, decides what each one is, and any corrective action follows your usual process.
Where it fits in your workflow
Ahead of the routine walk-over
Use the flags to set the order of the walk, and to look hardest at the ground that stands out. Your inspector records what they find in the same report as before. A flagged zone that turns out to be a dry spell is noted and left alone. One that turns out to be settlement or a break in the cover goes into your normal corrective action process. The quarterly change note gives you something to compare one season's walk with the last.
Limits
A flag is a reason to look
A stress patch has many causes. Drought, mowing, a recent seeding and winter dormancy all look like stress from above. Cover failure is one possible cause, and the flag cannot tell you which.
No gas sensor
Nothing here measures landfill gas. Vegetation condition is a proxy. A cap with gas migration under it can look healthy, and a stressed patch can sit over sound cover.
Resolution floor
Imagery finer than 10 cm shows patches and zones of vegetation, not a single cracked pipe boot or a hairline split in the liner. The method reads vegetation, never the liner itself.
Quarterly, not continuous
One flight a quarter, timed to the growing season where it matters. A problem that starts the week after a flight shows up in the next one.
Seasons and weather
Dormant or snow-covered ground says little about stress, so a winter quarter may carry fewer or no flags.
Early access
The flagging method is still being proven on real sites. It is not a certified monitoring method and meets no regulatory standard.
Who it's for
For
- Post-closure operators and solid waste managers with a capped cell to inspect on a thin budget.
- Environmental compliance engineers who want a second signal ahead of the walk-over.
- Owners willing to run a pilot on one cell and compare the flags with what the inspector finds.
Not for
- Sites that need a landfill gas measurement or a surface emissions scan.
- Active landfills or open cells that are still taking waste.
- Sites that need a certified or regulator-accepted monitoring method today.
- Continuous or alarm-style monitoring.
Questions before joining the list
Does a stress flag mean the cover has failed?
No. It marks ground where the plants are doing worse than their surroundings. Cover failure is one cause among several, and the inspector on the ground decides what it is.
Does it detect landfill gas?
No. There is no gas sensor involved. It reads vegetation condition from the air.
Why quarterly and not continuous?
Vegetation stress builds over weeks and seasons, so a pass each quarter fits how it develops. We don't offer real-time alerts.
What else sets off a flag?
Drought, mowing, new seeding, winter dormancy and bare ground from earthwork all read as stress. Tell us the cell's mowing and planting routine when you start, and the change note marks the flags it explains.
Is this an accepted monitoring method?
No. This is early access, run as a pilot on real capped cells. Your regulator and your post-closure plan still set what counts as monitoring, and the walk-over stays in place.
How do we check it against our own inspections?
Run the pilot on one cell and walk the flagged zones as part of your usual inspection. Compare what your inspector finds with what we flagged, and decide whether the signal earns a place in your programme.
Can we use the imagery and results in our reports?
The deliverables are for your own planning and your inspection file. Ownership and licence terms for the results and the imagery go in the pilot agreement before anything is flown.
Will it load into our GIS?
The map is a GeoPackage and the zones come as a CSV, so anything that reads a GIS layer or a spreadsheet can take them. We don't write into your systems.
How is a pilot bought and priced?
The price depends on the size of the cell and the platform flown, and we scope it for your pilot area. Tell us how your department buys services and we'll fit the pilot to that.
Get on the pilot list for your next capped cell.
Tell us which cell you'd monitor and when your next walk-over is due. We'll say plainly whether a pilot can fit.